Steven Greenwood and Chandrasekhar Ramakrishnan’s artistic transformation of the research results make the effect of the respective disposition either audible in sound sequences or visible on a monitor. It offers a condensed analysis of fleeting moments of art perception. Through artistic research methods, new types of images are created that reflect the museum’s effect and its fields of influence. In addition to the academic and statistical evaluation of the data and the questionnaires, for the first time this research project allows for an aesthetic embodiment of the effects of the museum and its exhibits.
The Installation
At the end of their stay in the exhibition 11 : 1 (+3) = Eleven Collections for a Museum, all museum visitors can enter the installation by the artists Steven Greenwood and Chandrasekhar Ramakrishnan created exclusively for eMotion. Here the artistic realisation of the museum visitors’ behaviour of perception is visible and audible. There are two video projections showing the aggregated data of the embodied visitors’ reaction; a sound installation shows the visitors’ reaction live, in real-time. At a TFT-table the visitors can see the paths they took after entering their visitor number. The visitors’ spatial behaviour, their individual paths through the exhibition rooms, respective walking speed and the time they spent in front of the exhibits were all saved. A map created from the visitor’s ˝dérive˝ showing the individual paths, emotional behaviour and the moments of art ˝interaction˝ is then printed out along with the respective visitor number. Each active visitor can take home his own ˝experience map˝, a graphic representation of his art perception.
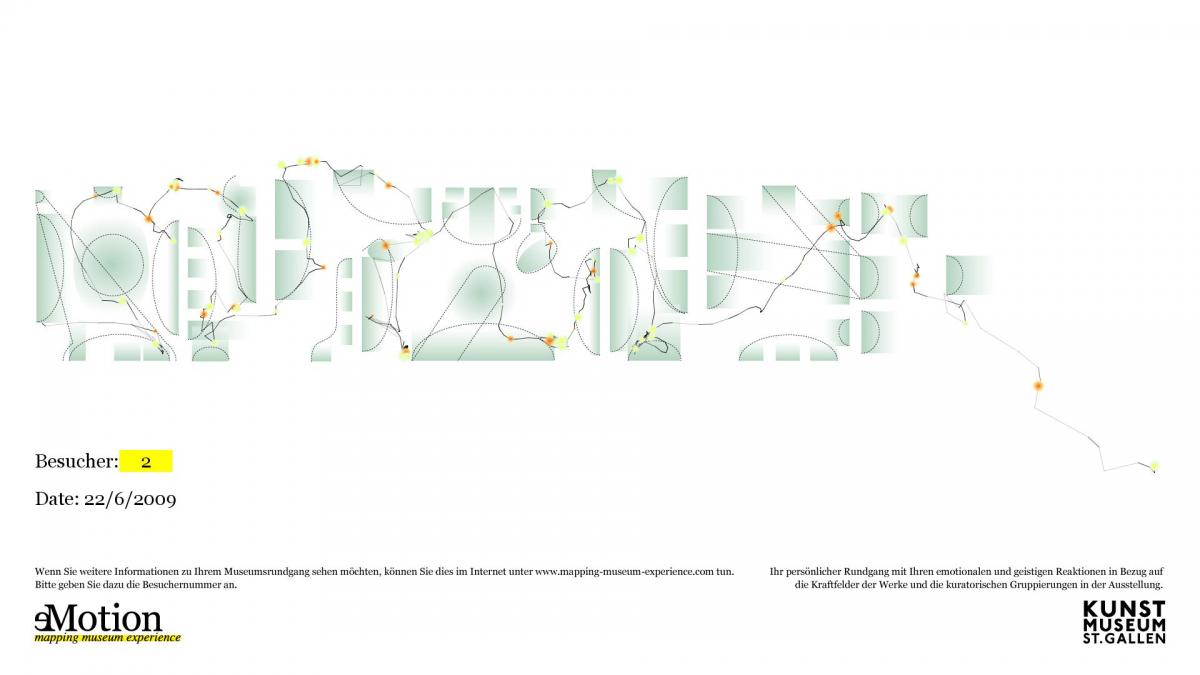
The following illustration demonstrates such an “experience map” from an elderly female visitor who is not particularly interested in art. (Below right: a visitor is given the data armband; afterwards they enter the exhibition. The faster a person goes, the more pale the line; the slower, the darker the line. In green are the “works’ areas of effect”. Red the GSR signifiers, yellow the HR signifiers.)
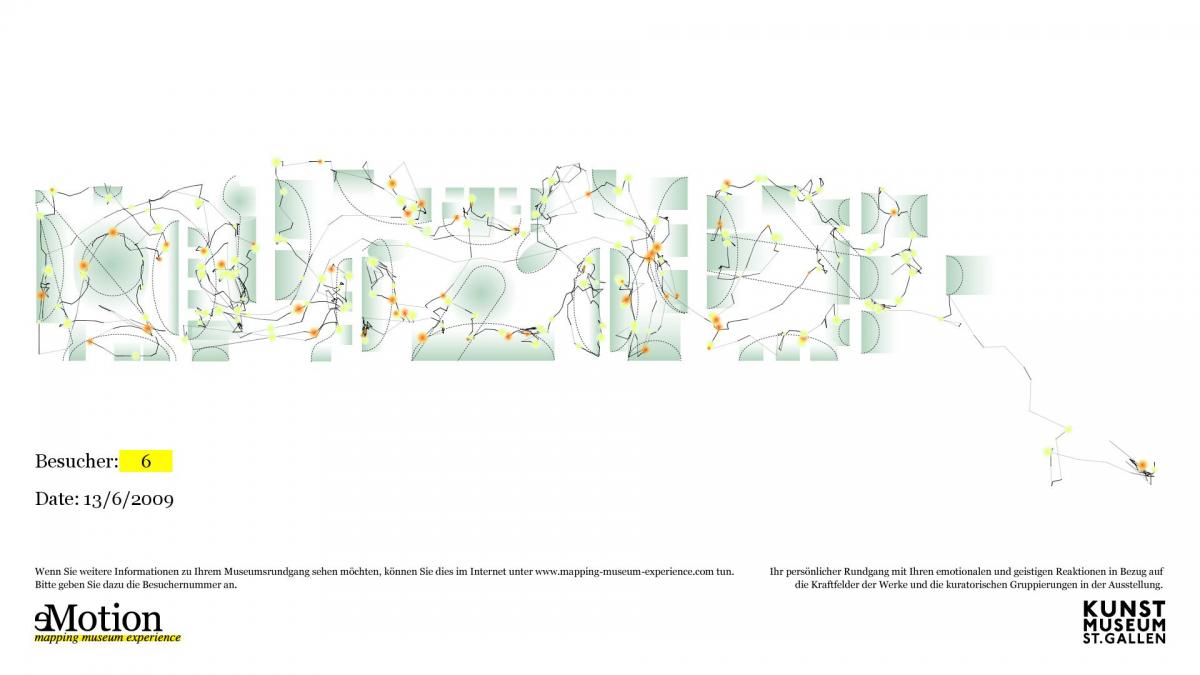
In contrast, here the individual profile of a young, very art-interested female visitor: The dynamic representation of the paths of visitor Nr. 6 allows one to easily identify the perception behaviour in the exhibition.
For a better understanding of the art reception we also analyse single Videos of Museum Visitors. See here the Video of Visitor Nr 6
The Museum as a Field of Influence
The visual realisation of the tracking data investigates the various spaces in the museum: the architectural space, the artworks’ area of effect, the curatorial space and the social space that the visitors create. Details on the accumulated representations:
A work’s area of effect can, for example, define its presence in the museum and it engages the visitor. In reference to Walter Benjamin’s concept of aura, the spaces around the artworks are represented as coloured shadows. At the beginning of every week of research, all exhibited objects have the same intensities. The more attention a work accumulates over the week, the more intense the representation becomes. The less a work is observed, the paler its field of influence.
To better understand the interdependencies between the works, the space and the visitors, in the framework of the research project processes were developed to generate sounds and images. They are instruments to investigate the physiological effect of the museum’s field of influence and its impact on the visitors.
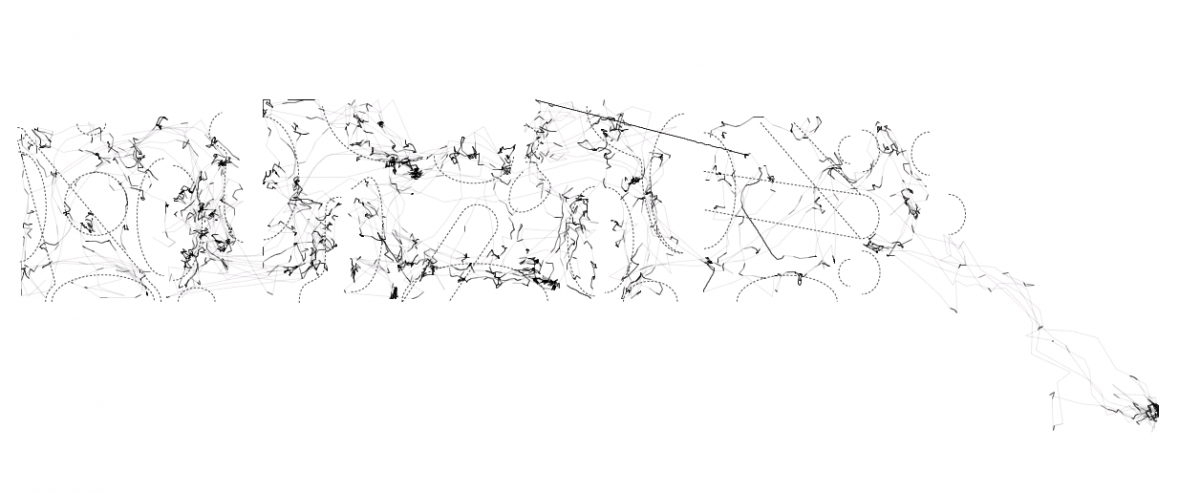
Illustration: Curatorial groups in relation to eight visitors’ paths and their walking speed.
– – – – – – – – curatorial groups _________ path of a visitor; the faster the person moves, the more transparent the line.
Electrodermally significant activity (orange) and heartrate signifiers (yellow) of the same visitor in reference to the curatorial groups.
Illustration: Paths and walking speeds in reference to the length of observation.
Ways of Reading the Exhibition
The exhibition 11 : 1 (+3) = Eleven Collections for a Museum unites different curatorial approaches. First, it can be read as an exhibition about the collection and donation history of the St. Gallen Art Museum, as the title intends. This collection history is emphasized by the exhibition texts (purple).
Second, the exhibition can be read as a tour through 20th century art history. In this case the tour follows a chronological order that is perceived in a visual/ sensual way. These groups, formed by art historical and curatorial approaches, are represented by dashed lines.
Illustration: The texts in the exhibition. Information signs are located at the sites marked with a “T”.
How do the visitors perceive the exhibition? Which way of reading the exhibition dominates? Which curatorial principles do they follow and to what extent? What role does the museum as an institution, the curator’s contexts, the artwork and the visitor play in the reception of art?
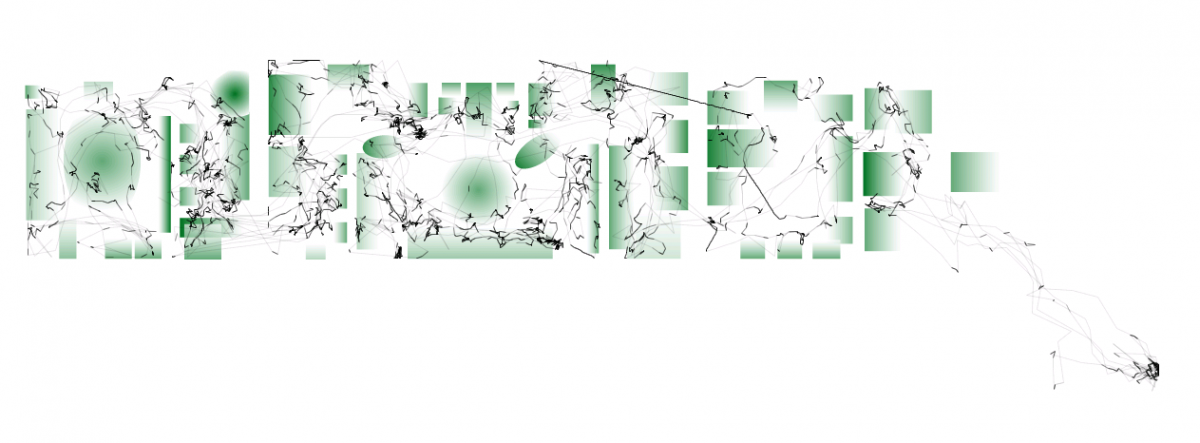
Illustration: Curatorial group in reference to the path and walking speed and biofeedback visitors.
The mosaic projection shows all the works that could be seen in the respective test series in the museum. At the beginning of every test series, all works had the same surface area – each work had the same chance of being observed. Through the different paths taken by the museum visitors, the size of the individual works changed according to the time taken to observe them. This change was shown per test series in a two-minute loop. The illustration show the end of the first test series loop.
Further representations of the spatial dimensions can be seen live at the St. Gallen Art Museum until July 25th. Here visitors also have the chance to actively participate in the national research project.
Experiment
During the period of research at the St. Gallen Art Museum in the framework of eMotion, different hypotheses on the effects of artworks were tested, for example through the way the works were hung and their position in space, or by changing the information on artists and the artworks. For each of the four test series, one specific experimental order was arranged.
The procedures to create images and sound in the framework of the research project give us the opportunity to make the effects of the different experimental series visible and audible. Thus the way the museum’s field of influence operates can be better understood.
Acoustic Representation of the Psychogeographic Data
In addition to the visual representation of the visitors’ data, a presentation on the acoustic level is created that passes on the information that can’t be transported on a purely visual level. The purpose of the acoustic procedure is thus to make the assembled data perceivable on a different level of the senses. In the process, we hope to reflect the visitors’ mood, or more specifically their different phases and changes during an exhibition visit. It is thus in no way a redundant procedure in which data is simply communicated twice (visually and acoustically), but rather as one that seeks the surplus value, the valeur ajoutée, that can occur when information is transported with different codes through various senses or channels of perception.
“Positus Musarum”, “The Muses’ Poses” is what Chandrasekhar Ramakrishnan calls his audio installation; it transforms the information gathered into sound. The data from the visits controls musical parameters such as pitch, volume and duration.
The sound installation stands for a form of sensual knowledge and provides us with an additional representation of the technical data. It uses the logic of sound – a different logic than that of an image – in order to reflect the special moments in the contact between a work of art and an observer.
Every visitor is represented by two voices. One voice is controlled by the heart rate and skin conductivity, the other by the position in space.
Each work is assigned a high voice that repeats as long as the visitor looks at this work.
In the moments when the visitor is especially physically engaged, the voices become louder and more noticeable. Interferences and friction are developed in the moment when the work “becomes art.”